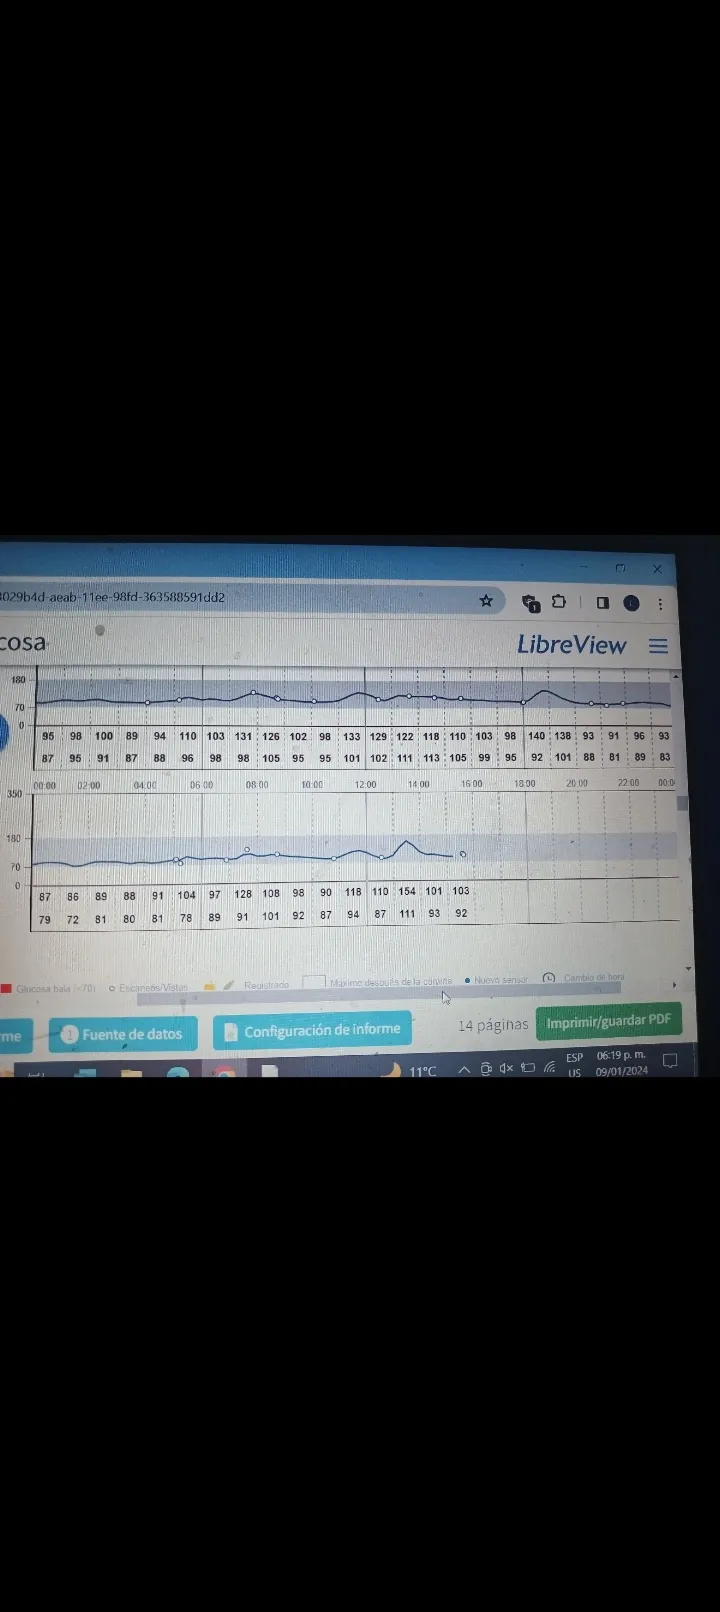
Hi how are things.Anyone who can help me with freestyle reading?That mean the values, since I see two figures up and down

Freestyle reading
Hi how are things.Anyone who can help me with freestyle reading?That mean the values, since I see two figures up and down
Resistencia a la insulina/Intolerancia los carbohidratos
Vildagliptina 50 mg C/24

Resistencia a la insulina/Intolerancia los carbohidratos
Vildagliptina 50 mg C/24
Hi Lilsy:
Vertical divisions are time intervals (one hour) The values below are the minimum and maximum at that time.
Congratulations, you have a wonderful curve, often control!

LADA desde septiembre de 2021
Toujeo y Fiasp
Aprendiendo
Just point the info they have already given you.
These values correspond to the maximum and minimal blood glucose during the established period of time, whether they are automatic device readings or you have done manually.Those readings that you make manually appear in the graph indicated with a white point.
You can also configure the report so that instead of the maximum and minimum include all the manual readings you do with the free style.
That parameter, the number of times you make reading after the day is taken into account by the doctor to know if you care about yours or not.
In case of insulin, it would also be reflected in the graph at the time and with the units that are.
Greetings. 
